Back to Projects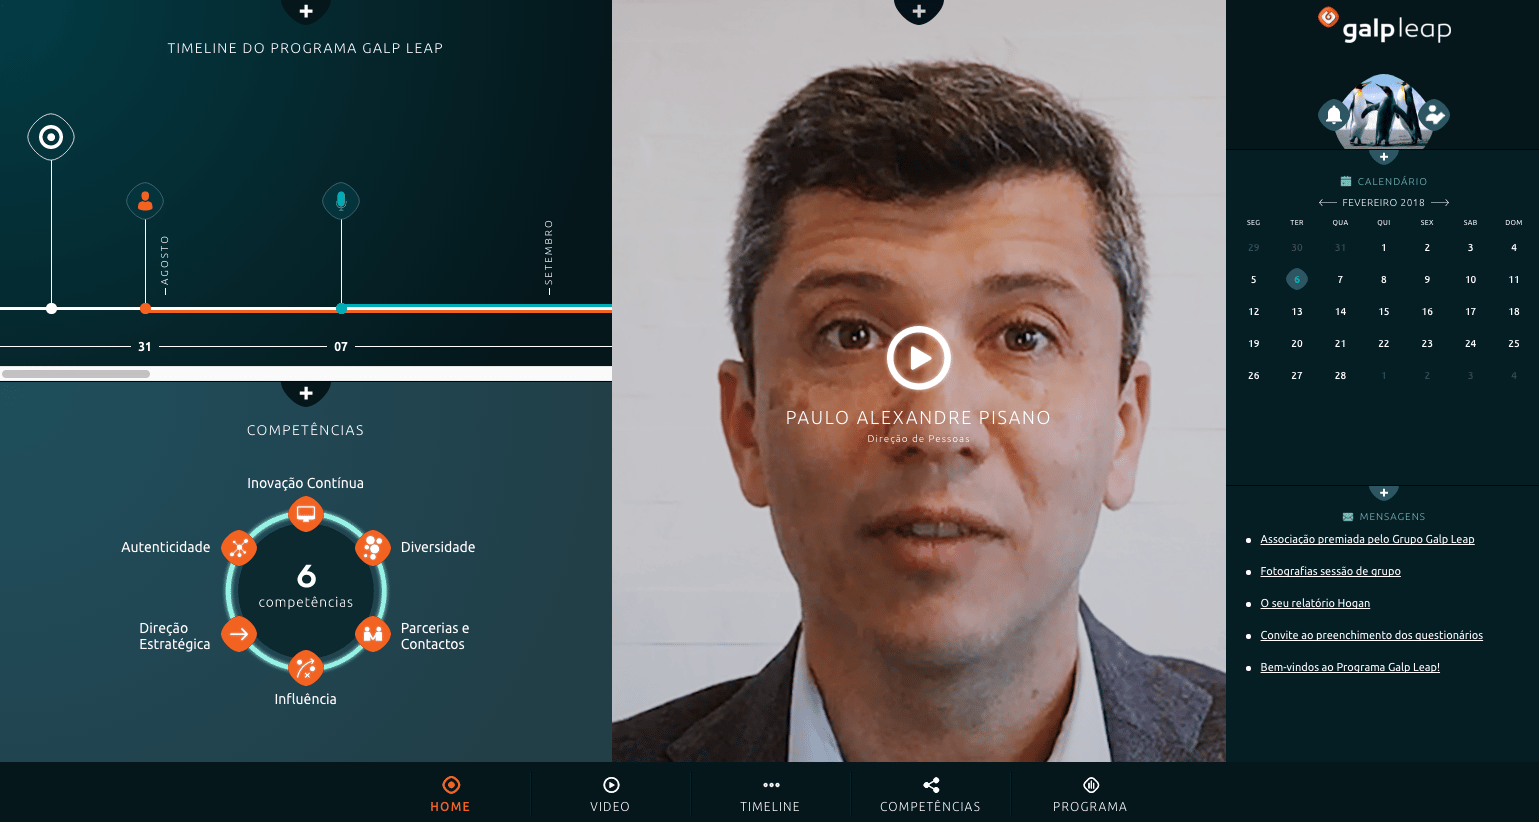
Galp, Leap RH
Project Narrative
The Challenge Building for the "C Suite" involves a unique set of constraints:
Data Security & Privacy: Handling sensitive financial goals and HR metrics meant implementing military grade security and strict access controls.
Information Density vs. Clarity: Executives need to see complex data (Leap metrics) at a glance, requiring sophisticated data visualization that is both deep and intuitive.
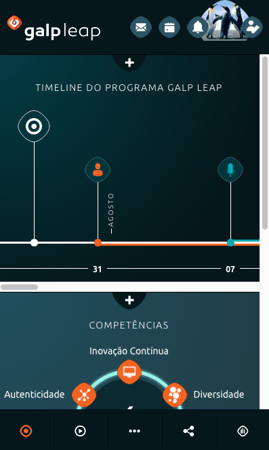
Cross Platform Reliability: The app needed to be a pixel perfect, stable experience on both high end iPads and corporate Android tablets.
The Solution
- The Executive Tablet Experience (React Native)
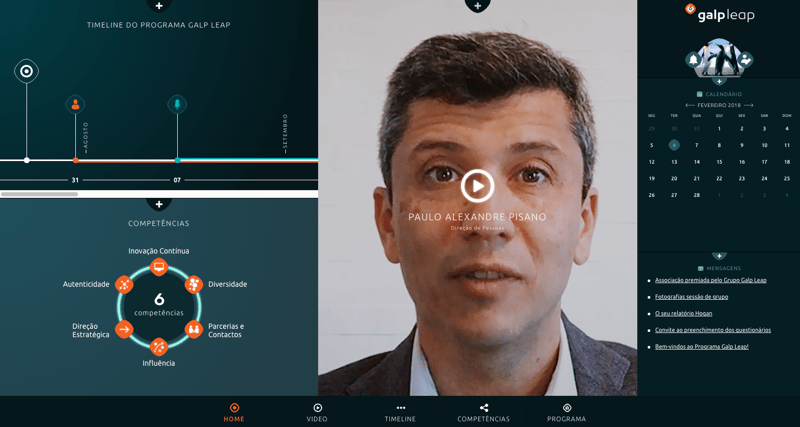
- Using the Bondlayer engine on React Native, I architected a dedicated tablet first experience. By leveraging the larger screen real estate, we built a modular dashboard system that allowed executives to drill down from high level "Leap" goals into granular department data without losing context.
Aggregated data from disparate HR and Financial systems.
- Advanced Data Visualization
- I developed custom data visualization components that turned raw financial and HR stats into actionable insights. Using a combination of SVG based charting and the Bondlayer data binding engine, we ensured that data updates were reflected instantly and smoothly across the dashboard.
The Impact Strategic Decision Making: Provided Galp’s top leadership with a "single source of truth" for internal goals, reducing the reliance on static reports and manual updates.
Executive Adoption: Successfully deployed a high stakes tool used daily by Top Management, proving the Bondlayer engine's capability for secure enterprise software.
Operational Efficiency: Automated the flow of HR and financial metrics into a mobile format, significantly speeding up the reporting cycle for the HR department.
Technical Highlights Framework: React Native (Optimized for iPad & Android Tablet).
Backend: Secure Node.js API
Data: Integration with Enterprise Data Warehouses via secure REST bridges.
Visualization: Custom React based charting libraries and dynamic KPI widgets.
Gallery